Workshop Spotlight
How do teachers integrate real-world cancer statistics into their classroom and help students understand the importance of public health data?
Image

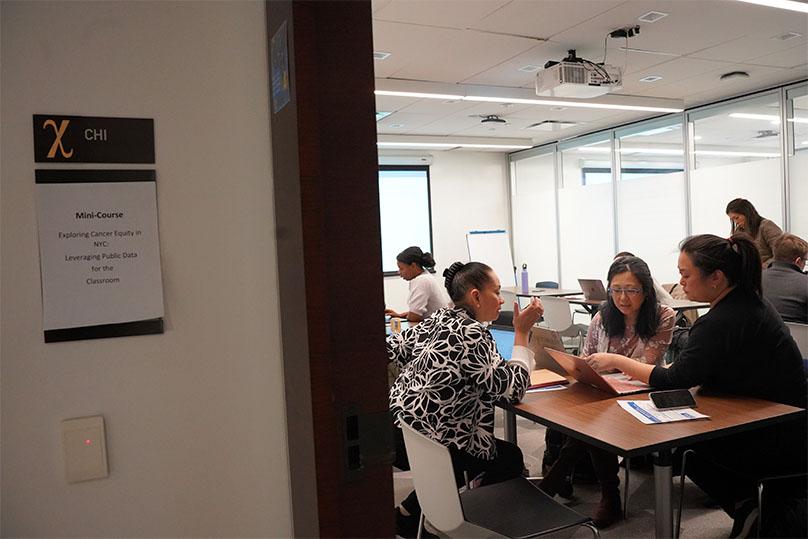
In the MƒA mini-course “Exploring Cancer Equity in NYC: Leveraging Public Data for the Classroom,” MƒA teachers explored cancer statistics across New York City and New York State and discussed how public health experts analyze and disseminate the information.
Led by Jasmine McDonald, Ph.D., Associate Professor of Epidemiology, and Mary Beth Terry, Ph.D., Professor of Epidemiology, both at the Mailman School of Public Health at Columbia University, the goal of this course was to make cancer education more accessible to teachers through lecture materials that meet NGSS standards and resources that facilitate actionable solutions. This course was built on a previous MƒA mini-course, “Equipping Educators With an Equity Lens on Cancer,” where teachers collaborated on curriculum and hands-on activities designed to encourage students to participate in their own cancer risk reduction—from science to personal behaviors to advocacy.
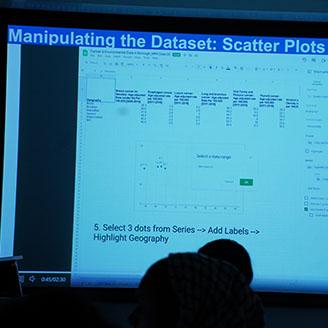
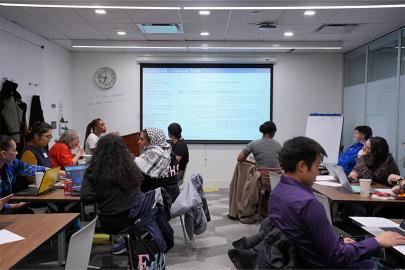
In the first session of this new course, teachers familiarized themselves with a cancer health dataset from the NYC Environment and Health Data Portal, examining specific cancer types by borough and sociodemographic characteristics. In the second session, they discussed how datasets can be used to inform policy and public health practices, and then developed their own public health research questions. For the final session, teachers collaborated on different ways to integrate data and data analysis into existing lessons or new projects.
“MƒA teachers are always so engaged and delightful,” said Dr. McDonald. “We had the opportunity to learn from them as we hope they have learned from us,” added Dr. Terry.
Image
Throughout the course, MƒA Master Teacher Eric Siu, who teaches high school biology, thought about the components he would want students to walk away with. As he puts it, “the data was just the input.”
“Cancer statistics can introduce students to available databases and demonstrate how data can be gathered, repackaged, and analyzed to explore potential correlations,” said Siu. “But just as important, I want students to be able to make sense of the data so they have that skill in the future no matter what the data could be.”
Some of the ideas Siu and his fellow teachers proposed included creating a scatter plot, looking at trends, evaluating statistical significance, and creating a hypothesis.
Dr. McDonald and Dr. Terry observed other creative ideas developed by teachers to incorporate data in their classrooms, including combining specific substantive questions with methodological testing of hypotheses, and having students create their own data dictionary or codebook.
“We aim for this type of work to be a low lift for already busy teachers,” said Dr. McDonald. Dr. Terry added, “We actively listened to them discuss the challenges and share what topics would matter most to their students. We enjoyed coming back with modified or new materials to facilitate options for classroom implementation.”
Teachers also analyzed a research letter, considering aspects such as the authorship, publication date, the problem addressed, and its significance. They were encouraged to guide students in drawing their own conclusions using graphs and tables.