Workshop Spotlight
As our climate changes, we all feel the increased heat, but how can we visualize and quantify it? Can teachers integrate data visualization tools into the classroom to encourage environmental justice among their students?
Image
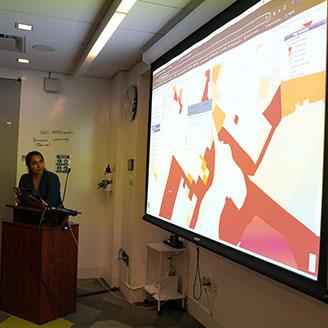
After previously working with the National Center for Disaster Preparedness (NCDP), MƒA Master Teacher Tamanna Shahid realized that emergency planning organizations possess valuable climate change research and mapping tools that they, although eager to share, often fail to deliver to K-12 educators.
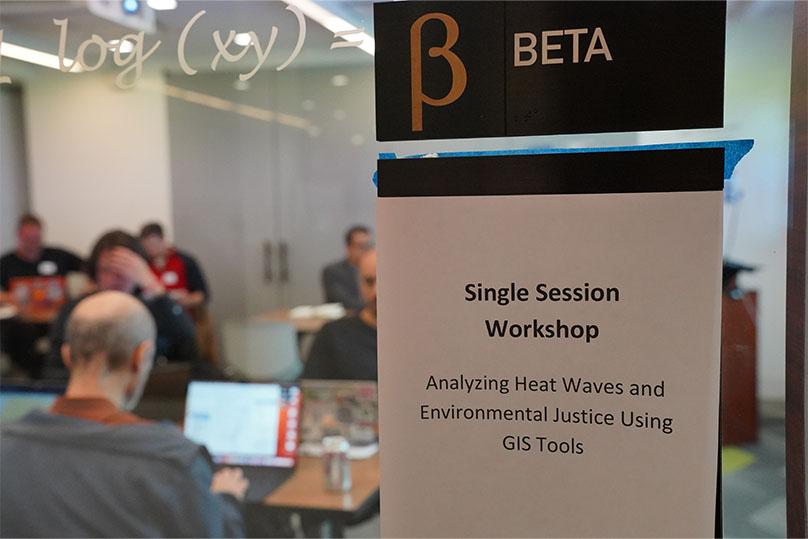
Hoping to bring related resources to teachers and students in order to instill hope and spark action, Shahid led the MƒA single-session course, Analyzing Heat Waves and Environmental Justice Using GIS Tools. Here, MƒA teachers worked with Geographic Information System (GIS) tools such as the United States Environmental Protection Agency’s (EPA) Environmental Justice Screening and Mapping Tool (EJSCREEN). This tool provides the EPA with a nationally consistent dataset and approach for combining environmental and socioeconomic indicators, helping identify communities and areas that are disproportionately affected by heat waves and climate change. “As we are unable to reverse climate change, building awareness and community resilience to impactful weather events is now the priority,” said Shahid.
Image
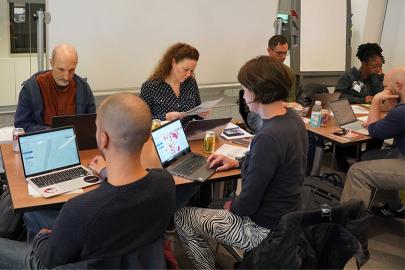
Throughout the course, teachers explored various demographic indices such as pollution, health disparities, and socioeconomic factors, comparing them with national and state-level data. They then looked at the disproportionate impact of climate change on NYC communities and discussed how mitigation techniques could build greater “resilience,” while making connections to, and analyzing strategies to address, the Urban Heat Island Effect.
“These GIS tools are constantly at risk of being hidden from the public to downplay the need for environmental justice. It makes it all the more important to share this work with as many students and educators as possible to create lasting changes,” added Shahid.
Using the Claim, Evidence, and Reasoning (CER) technique, participants investigated specific NYC neighborhoods and beyond to identify resilience to hazards. They used jigsaw, sense-making, and introductory mapping activities which teachers could then implement in their classrooms.
“Visualizations are so important for my students,” said MƒA Master Teacher Nick Franzén, who registered for this course looking to deepen his understanding of GIS tools. “Using EJSCREEN showed me just how much can change from block to block and the fact that I can make these tools accessible to my students is huge. Putting the power in their hands is a great step towards engagement and deep connection.”
Dr. Josh DeVincenzo (Assistant Director of NCDP) fielded questions from MƒA teachers focused on centering students and their lived experiences, as well as those of educators, leading to a rich discussion on how to form connections in the classroom.